%20Simple%20Steps%20to%20Smarter%20Choices.png)

Making smart decisions in business has always been about understanding the bigger picture, but now, that picture is made up of data. Whether you're running a small startup or leading a global enterprise, the ability to turn data into clear, actionable insights is what sets successful companies apart.
That’s where business intelligence (BI) comes in. It’s not just about collecting information—it’s about knowing what to look for, how to interpret it, and how to use it to move your organization forward.
With the world expected to generate 175 zettabytes of data by 2025 (according to IDC), it’s clear that the real challenge isn’t access to data—it’s making sense of it. BI helps you do exactly that: cut through the noise, uncover trends, and make confident, informed decisions.
This guide is designed to help you understand what is meant by business intelligence, how it works, the benefits it offers, and how your organization can use it to thrive.
TL;DR (Key Takeaways)
Business intelligence (BI) refers to the technologies, processes, and practices that collect, integrate, analyze, and present business data to help organizations make better decisions. In simple terms, it’s the system that answers the big question: “What’s happening in our business, and what should we do about it?”
At its core, business intelligence is about transforming data into insights. It pulls information from multiple sources—sales, marketing, finance, and operations—and delivers meaningful reports, dashboards, and visualizations that drive smarter actions. Whether it’s spotting a sales dip early or forecasting inventory demand, BI bridges the gap between data and strategy.
What is meant by business intelligence?
It means empowering your teams to access and interpret key metrics without relying solely on IT. BI turns decision-making from reactive to proactive.
For example, a retail brand might use BI to:
Or, in finance, BI helps:
BI isn’t just about hindsight—it enables foresight.
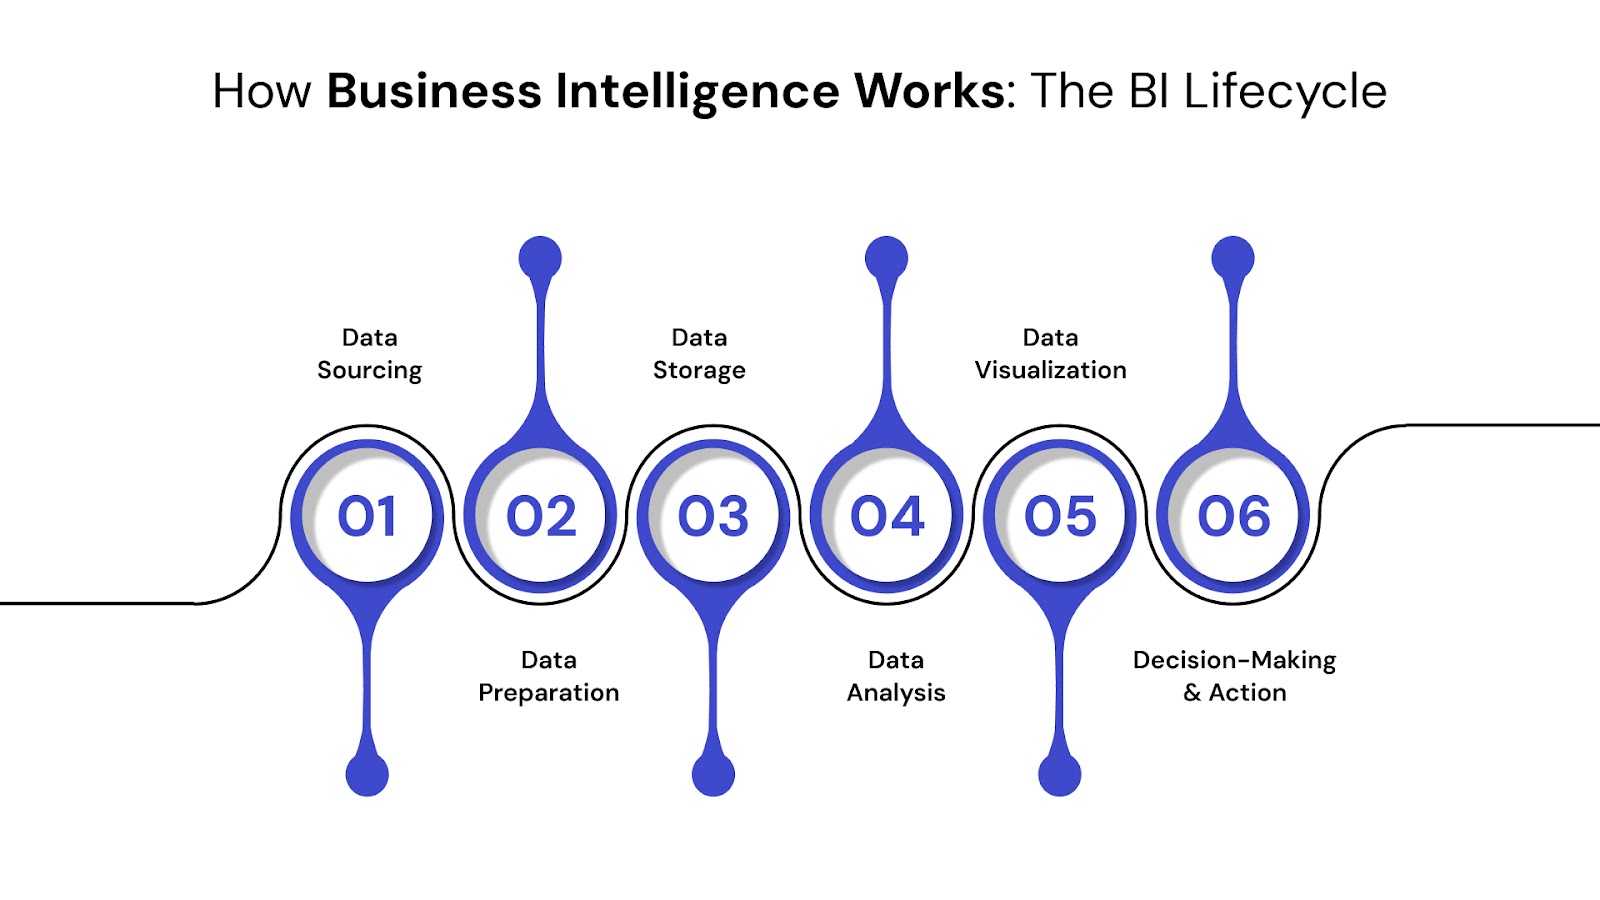
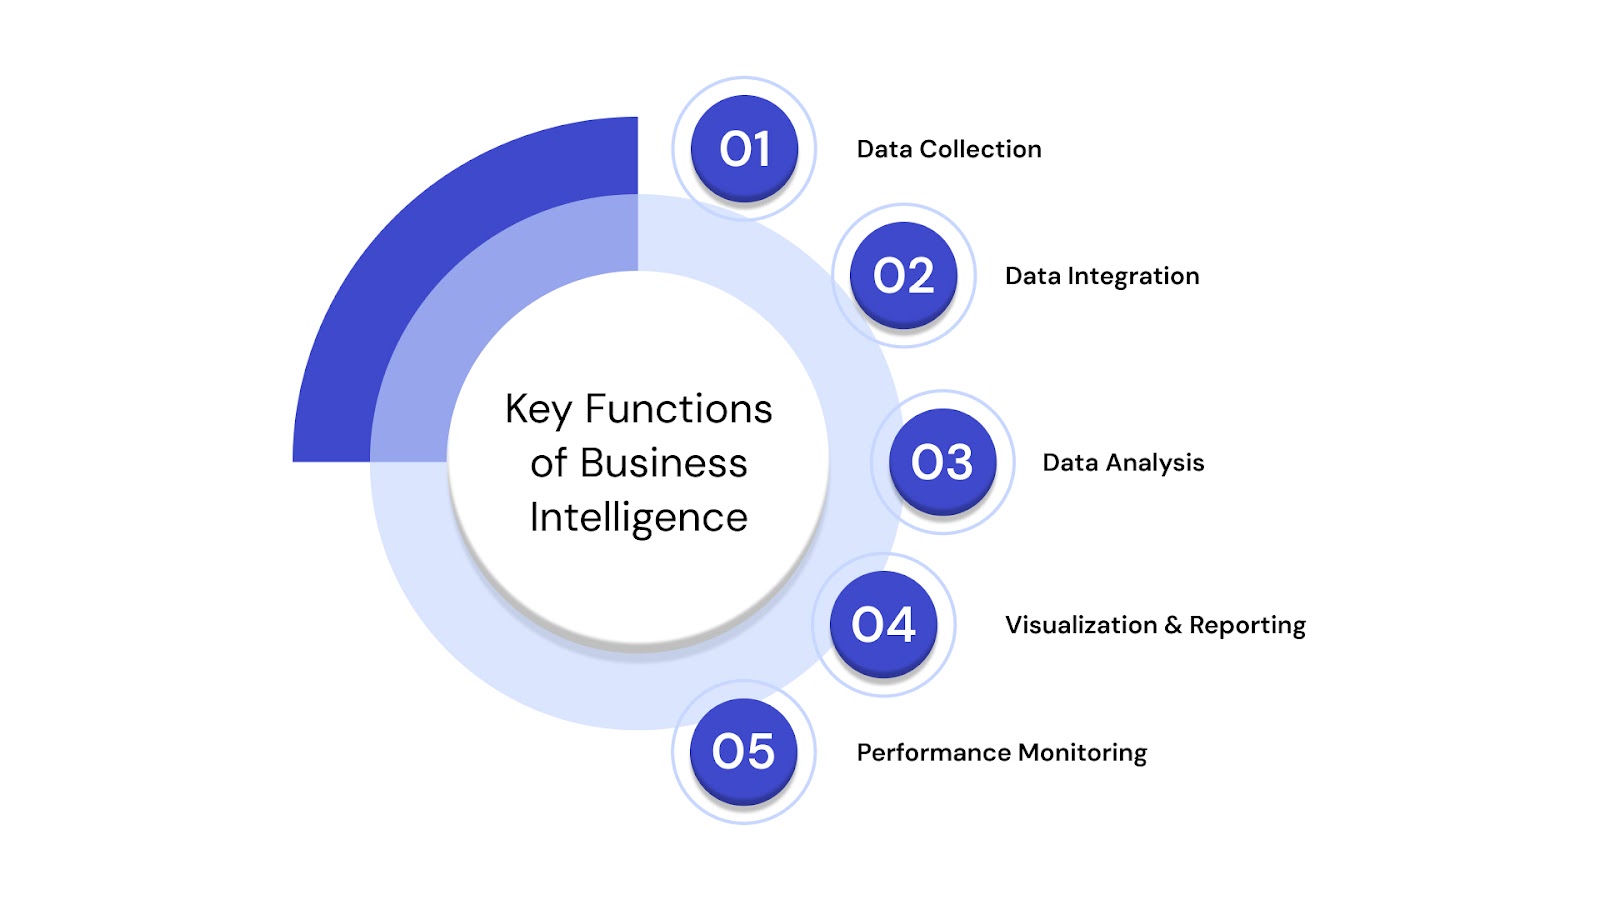
Business intelligence isn’t a one-time tool—it’s a continuous, iterative process that transforms raw data into real-time, actionable intelligence. The BI lifecycle consists of several interconnected stages that turn scattered data into strategic assets.
Data is pulled from various sources, including:
This stage answers: What data do we need and where is it coming from?
Next, data is cleansed, validated, and transformed into a usable format through ETL (Extract, Transform, Load) or ELT processes. This ensures consistency, removes duplicates, and resolves data conflicts—essential steps before analysis begins.
This is where data quality becomes critical. Inconsistent or inaccurate data at this stage can undermine the entire BI process. You can read more about the role of data quality in governance and analytics here: Your Essential Guide to Master Data Governance
Prepared data is stored in a data warehouse or data lake, depending on the volume, structure, and use cases. These centralized repositories serve as the “single source of truth” for analysis.
Now comes the real magic—data scientists, analysts, or even business users query the data to generate reports, dashboards, or predictive models. This stage involves:
BI tools like Power BI, Qlik, Tableau, and Looker make these insights accessible and intuitive.
Visualizing data makes insights more digestible. Dashboards, charts, and graphs help different teams understand trends and KPIs at a glance. Interactive dashboards support real-time exploration, empowering decision-makers across departments.
If you want to explore how strong data visuals improve decision-making, read
The final step is execution. BI insights feed into real-time alerts, strategic planning, budgeting, marketing campaigns, operational changes, or customer experience improvements.
Design dashboards that go beyond charts — enabling teams to explore trends, monitor KPIs, and act on insights in real time.
View Visualization Solutions →
The true value of business intelligence lies not in the data itself, but in how effectively organizations use that data to gain clarity, confidence, and a competitive edge. Here are the key business intelligence benefits modern organizations can expect:
With real-time dashboards and consolidated reporting, BI eliminates guesswork. Decision-makers no longer have to wait for end-of-quarter reports—they can access live data on customer behavior, sales trends, inventory levels, and financial health at any moment.
BI answers questions like:
Business intelligence helps identify inefficiencies across departments. Whether it’s supply chain bottlenecks or excessive marketing spend with little ROI, BI insights help optimize processes and reduce waste.
By tracking metrics such as customer lifetime value, purchase frequency, and support interactions, BI empowers companies to tailor offerings, personalize engagement, and proactively address churn risks.
BI tools support predictive analytics, helping organizations anticipate market shifts, seasonal demands, and growth opportunities. This enables smarter forecasting, budgeting, and capacity planning.
From sales to finance to HR, BI fosters data transparency. Everyone works off the same version of truth, reducing miscommunication and aligning teams around common KPIs.
Despite its advantages, implementing BI isn’t plug-and-play. Here are the most common roadblocks companies face—and how to overcome them.
Garbage in, garbage out. If your data is inaccurate, outdated, or siloed, your insights will be flawed. This makes data quality governance critical to BI success.
You can learn how to improve your data pipelines here: Smarter Data, Better Decisions: Data Engineering at QuartileX
Rushing into BI without aligning it to specific business goals often leads to underutilized tools and low adoption. Organizations need to clearly define the questions they want BI to answer before they begin.
If BI tools are too complex or technical, non-technical staff will avoid them. Choosing user-friendly platforms and offering proper training can bridge the gap.
Data spread across CRMs, ERPs, and spreadsheets can lead to inconsistent reporting. BI success requires integrating and harmonizing data from multiple systems.
Rolling out a business intelligence program successfully goes beyond choosing the right tools. It requires a well-structured, strategic approach. Below are best practices to help ensure your BI initiative delivers long-term business intelligence insights and value:
Before investing in any BI tools or platforms, identify the business problems you want to solve. Whether it's reducing churn, improving sales performance, or optimizing inventory, your goals should drive your BI roadmap.
Ask yourself:
Involve business leaders, analysts, and end-users from the start. Their input ensures the BI system addresses real challenges and gains internal support. Cross-functional collaboration reduces the risk of building a system no one uses.
Your BI system is only as good as the data feeding it. Establish a strong foundation of data quality and governance before implementation.
This includes:
Pick tools that match your users’ skill levels and your organization’s scale. Tools like Power BI, Tableau, and Sigma Computing offer flexibility for both technical users and business users.
QuartileX works closely with clients to match BI tools to their environment, whether you need self-service dashboards or enterprise-grade analytics platforms.
Train employees on how to use dashboards, interpret data visualizations, and turn findings into decisions. Without training, even the most intuitive BI platform can go underutilized.
BI isn’t a “set it and forget it” system. Monitor usage, gather feedback, and iterate. Update your dashboards, adapt KPIs, and evolve your analytics strategy as business needs change.
Build interactive dashboards and visual systems that translate complex data into clear, actionable insight — when and where it matters most.
Design Smarter Dashboards →
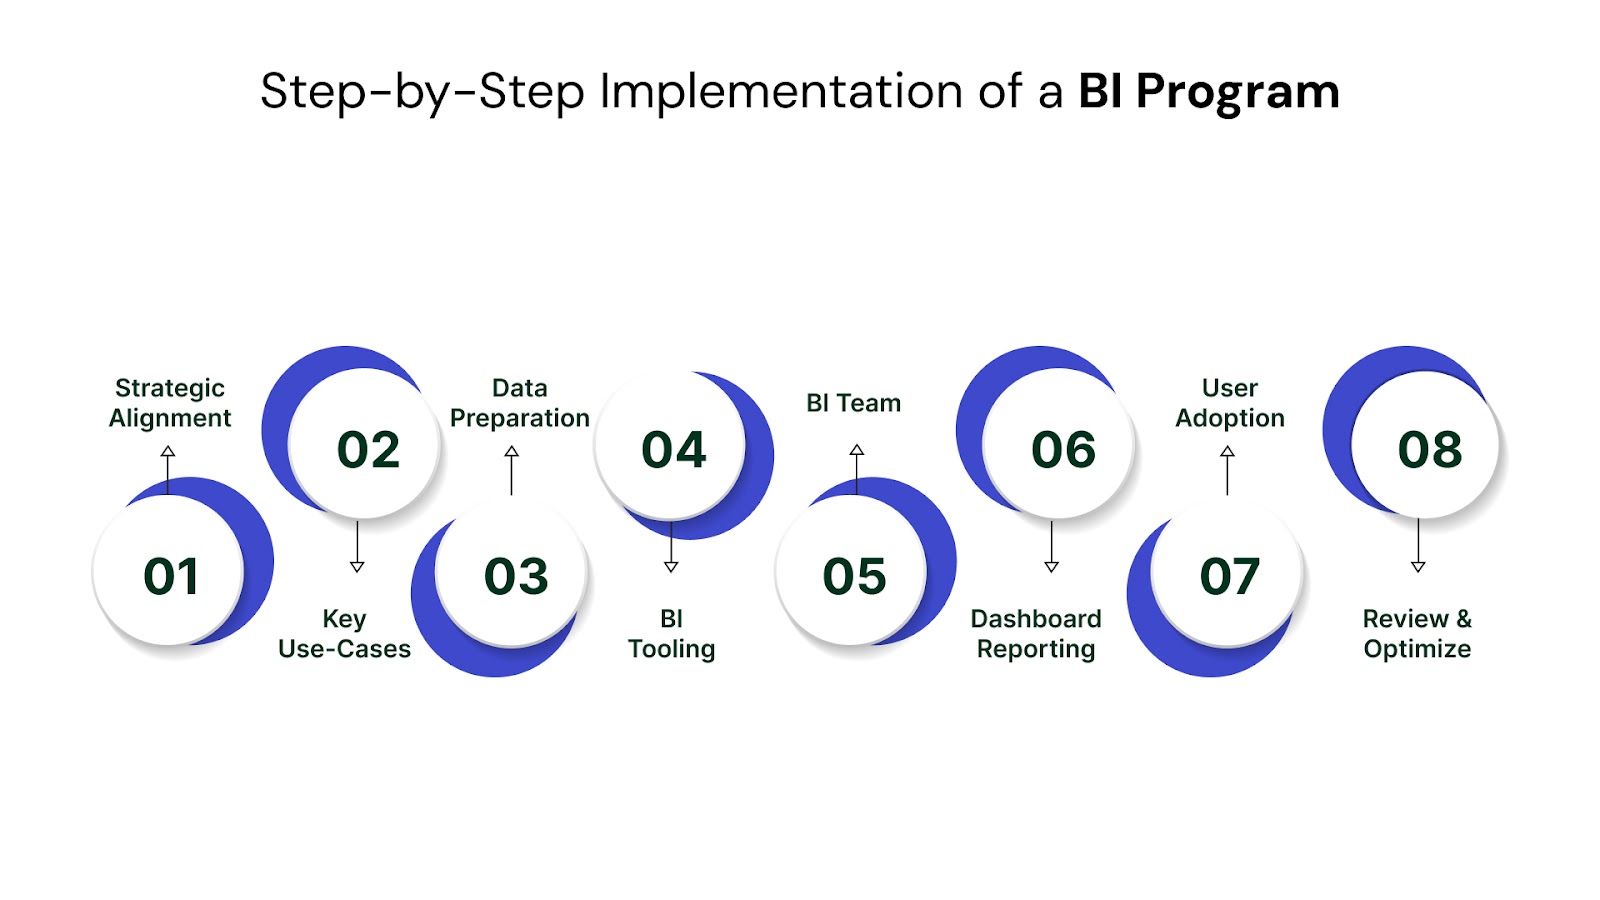
Now that you know the best practices, here’s a simple, actionable approach to implementing a business intelligence system:
Your BI initiative must directly support your key business objectives. Link it to measurable outcomes (e.g., improve customer retention by 15%).
Don’t try to solve everything at once. Start with high-impact use cases like sales forecasting, churn analysis, or marketing attribution.
Evaluate current data sources, assess data quality, and implement a plan for cleaning and integration.
Choose tools that integrate well with your existing tech stack and can scale with your business.
Include data engineers, analysts, business users, and IT support. Clear roles help ensure smooth execution.
Design with the end user in mind. Visuals should be clean, easy to interpret, and focused on KPIs.
Roll out the platform with a training plan and internal champions who can support their teams.
Use analytics to monitor dashboard usage, performance, and ROI. Adjust as needed.
Business intelligence is evolving rapidly, influenced by advancements in AI, cloud technologies, and increasing demands for real-time decision-making. Here are some of the most important trends shaping the future of business intelligence:
Modern BI platforms are moving beyond descriptive analytics. With AI and ML, businesses can now uncover predictive patterns and automate insights. Expect BI tools to offer features like:
These capabilities reduce manual analysis and make business intelligence more accessible across departments.
As organizations democratize data, non-technical users are demanding tools they can use independently. Self-service BI empowers marketing, sales, and operations teams to generate their own reports and dashboards without relying heavily on IT.
This shift boosts agility and allows insights to reach decision-makers faster.
BI is no longer just about separate dashboards — it’s becoming part of day-to-day tools. Embedded BI lets teams view relevant analytics inside CRMs, ERPs, and custom applications.
Imagine sales reps viewing account health directly within their CRM, or ops teams seeing supply chain alerts embedded in their workflows.
Cloud-based business intelligence platforms offer scalability, easier integration, and lower infrastructure costs. As more organizations adopt hybrid or multi-cloud strategies, BI tools must be cloud-native to:
At QuartileX, we help businesses implement cloud-optimized BI architectures that support flexibility, speed, and security. Explore our secure cloud solutions for more details.
Waiting hours or days for data is becoming unacceptable. Businesses want real-time visibility into performance, customer behavior, and market trends.
With real-time BI:
As BI becomes more embedded in operations, maintaining trust in data is paramount. Businesses must double down on data governance and data quality to ensure decisions are based on reliable information.
Business intelligence is no longer a competitive edge — it’s a business essential.
From better decision-making and operational efficiency to predictive insights and strategic planning, BI gives organizations the tools they need to thrive in a data-saturated world. But to realize its full potential, BI must be approached with a clear strategy, the right tools, and a commitment to data quality and governance.
At QuartileX, we specialize in building tailored business intelligence systems — from architecture to dashboards to user training. Whether you're just starting out or scaling a mature BI function, we help turn your data into a true strategic asset.
Turn raw data into strategic insights with real-time dashboards and data storytelling built for fast, confident decision-making.
View Visualization Solutions →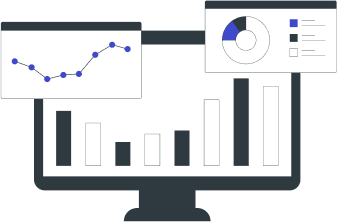
Explore our Data Analytics & Visualization Services
1. What is meant by business intelligence?
Business intelligence (BI) refers to the technology, processes, and tools used to collect, analyze, and present data to support business decision-making.
2. How does business intelligence provide insights?
BI tools process raw data into reports, dashboards, and visualizations, revealing patterns and trends that inform better decisions.
3. What types of tools are used in BI?
Popular BI tools include Tableau, Power BI, Looker, Sigma Computing, and Qlik — all used for data visualization, analysis, and reporting.
4. Is business intelligence only for large enterprises?
Not at all. With cloud-based and self-service tools, BI is accessible and valuable for startups, SMBs, and enterprises alike.
5. Why is data governance important in business intelligence?
Without governance, data may be inaccurate, inconsistent, or insecure, leading to poor decisions. Governance ensures data is trustworthy and compliant.
From cloud to AI — we’ll help build the right roadmap.
Kickstart your journey with intelligent data, AI-driven strategies!