.png)

Did you know? Nearly 74% of businesses reported struggling to extract value from their data. The problem isn’t a lack of information. It’s a lack of strategy.
With data flowing through every customer touchpoint and internal system, simply collecting it isn't enough. To move from raw data to real business outcomes, you need a structured analytics strategy that aligns with your goals.
This guide outlines why a clear data analytics strategy matters, how it works, and how it can transform decision-making across your business.
TL;DR
Before we explore the details, here’s a quick overview of what a data analytics strategy offers:
A data analytics strategy is a structured approach to managing how data is collected, analyzed, and applied to business decisions. It creates a clear link between business needs and data use, helping teams focus on outcomes instead of reports.
Rather than chasing metrics in isolation, your teams work toward defined goals using the right data tools, systems, and ownership structures.
According to IDC, companies with mature analytics strategies report significantly better customer satisfaction and operational performance. Companies driven by data are 23 times more likely to acquire customers. For small businesses, data analytics offers a smart and scalable path to consistent growth.
To understand the impact of analytics, it’s important to look at how it functions within your business.
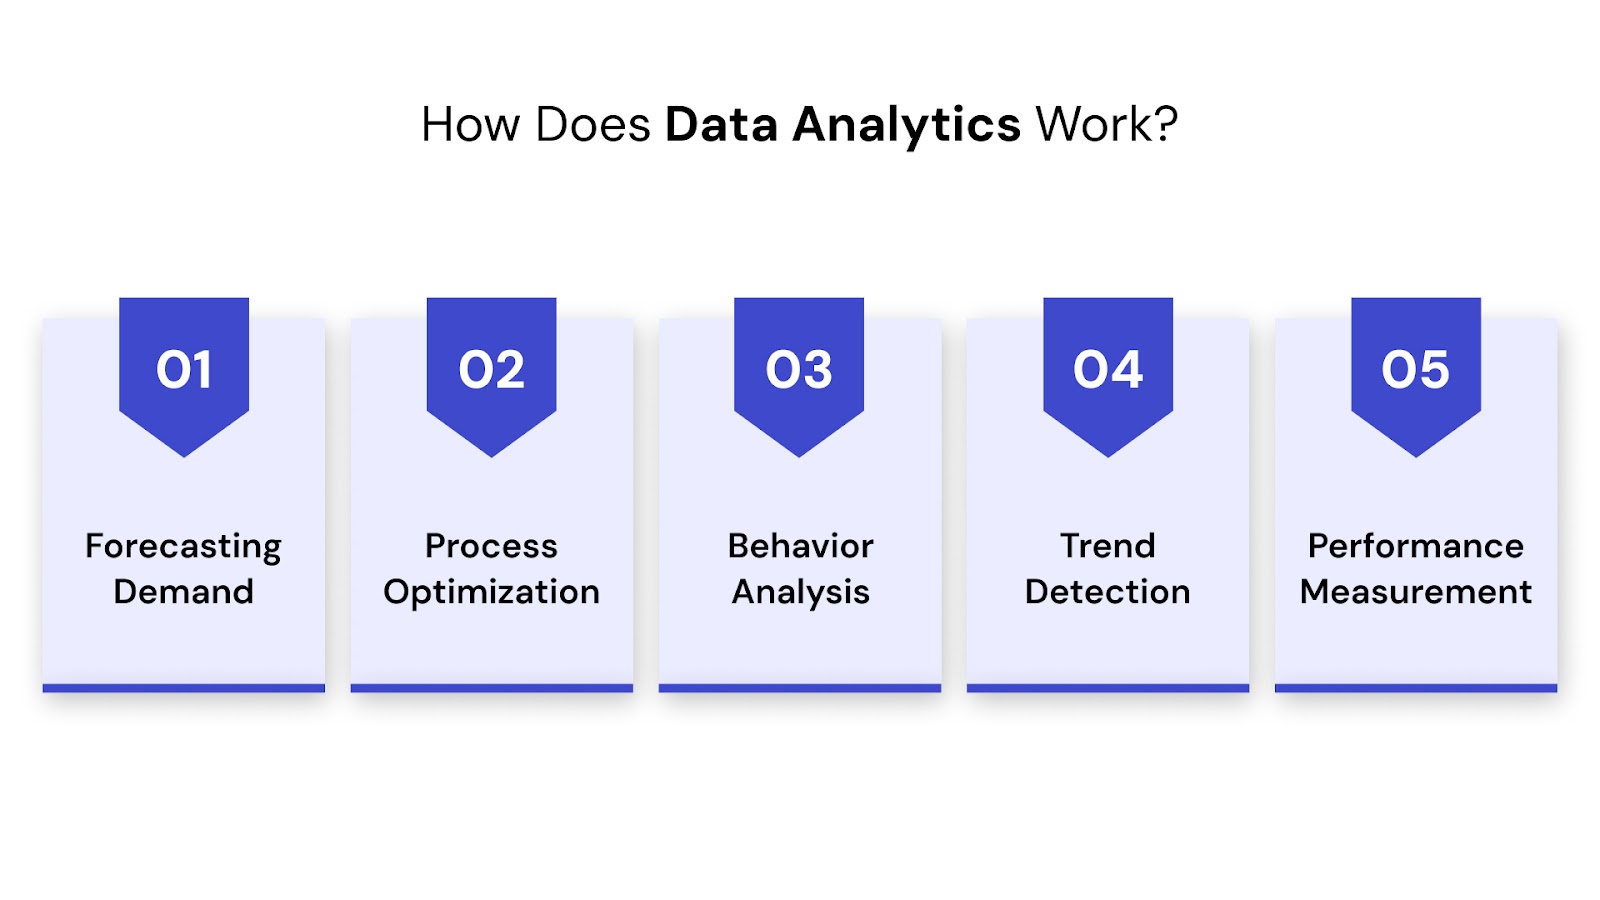
Think of analytics as the bridge between information and insight. Without it, businesses operate on assumptions and gut feelings. With it, decisions are based on evidence, patterns, and predictive signals.
Key functions supported by analytics platforms include:
The process typically involves collecting raw data, preparing it through transformation and validation, and using analytical tools to surface insights that support specific decisions.
We’ll assess your current infrastructure and help you map a smarter, more cost-efficient path forward.
Request a Readiness Assessment →
Now that we’ve seen how analytics works, let’s look at why a formal strategy matters.
As businesses generate more data across systems, teams, and touchpoints, the real value lies not in how much data is collected, but in how it's used. Without a structured approach, even the most data-rich organizations can struggle to take action or identify what's working.
A clear data analytics strategy helps teams move from reactive choices to proactive decision-making. It brings alignment, clarity, and measurable progress across departments.
Here are six key reasons why every business should have a clear data analytics strategy:
Want to see how a clear data analytics strategy works in real scenarios? Take a look at our in-depth guide on data pipeline architecture
Now that you know why it matters, let’s look at how to build one from scratch.
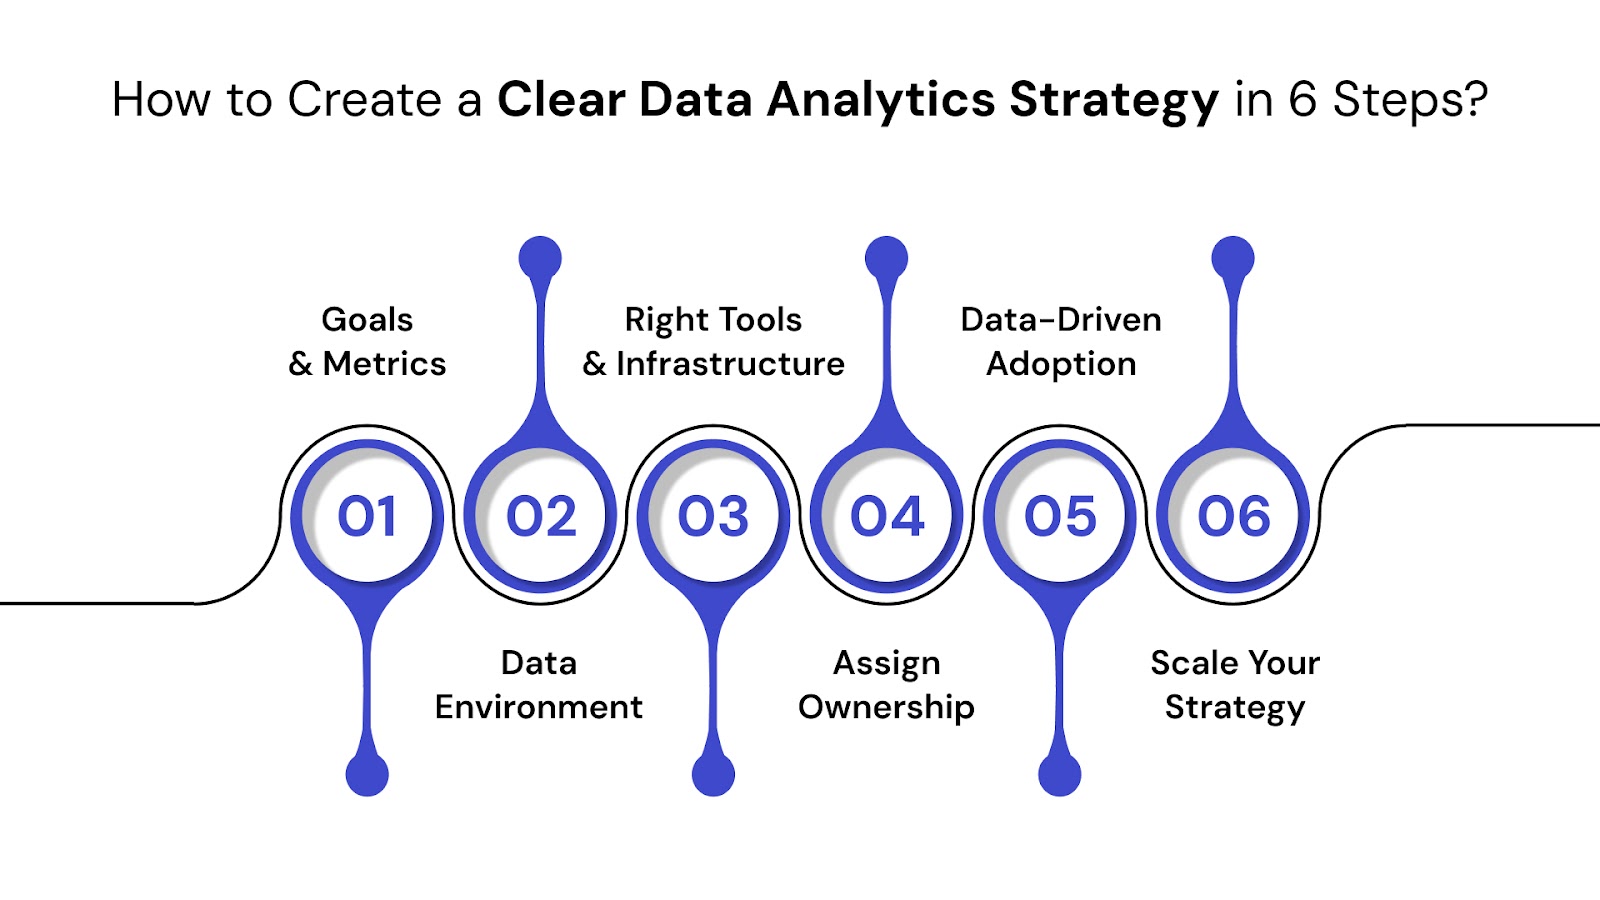
Building a clear data analytics strategy isn't just about choosing the right tools or creating dashboards. It's about creating a foundation that supports every stage of decision-making, across every department.
Whether you're just getting started or refining your current approach, the following six stages offer a practical roadmap with specific examples and action steps that tie directly to business outcomes.
Once the need is clear, the next question is: where do you begin? Before exploring into datasets, get clarity on what matters most. Setting clear goals ensures that analytics work stays focused and measurable.
Start with clear questions. What problems do you want to solve? What outcomes are most critical for your business this quarter? Whether it’s increasing revenue or reducing churn, anchor your analytics efforts to measurable outcomes.
Example: A SaaS company focusing on churn identifies first-week user engagement as a key metric.
Action Step: Host a stakeholder session to outline your top three priorities for the next quarter.
Once you’ve defined goals, align 2–3 KPIs to each. Use metrics like CAC, ARPU, or conversion rate to quantify progress.
Example: A B2C app targeting growth focuses on CAC and daily active users to track success.
Action Step: Set performance benchmarks using past data or industry standards.
Take inventory of the data you already collect and match it to business goals. This helps clarify what insights you can extract right away.
Example: A company working to reduce delivery delays maps logistics data, warehouse logs, and timestamps.
Action Step: Build a data mapping table linking KPIs with current data sources.
At QuartileX, we design reliable and scalable data ingestion workflows that connect smoothly with your target systems. Explore our data engineering services to see how we deliver fast, high-performance pipelines and to create a clear data analytics strategy
From cloud readiness to AI integration, we’ll help you design a strategy that’s aligned with your goals — and built to scale.
Talk to a QuartileX Expert →
Once your goals are set, take stock of the systems and data already in place.
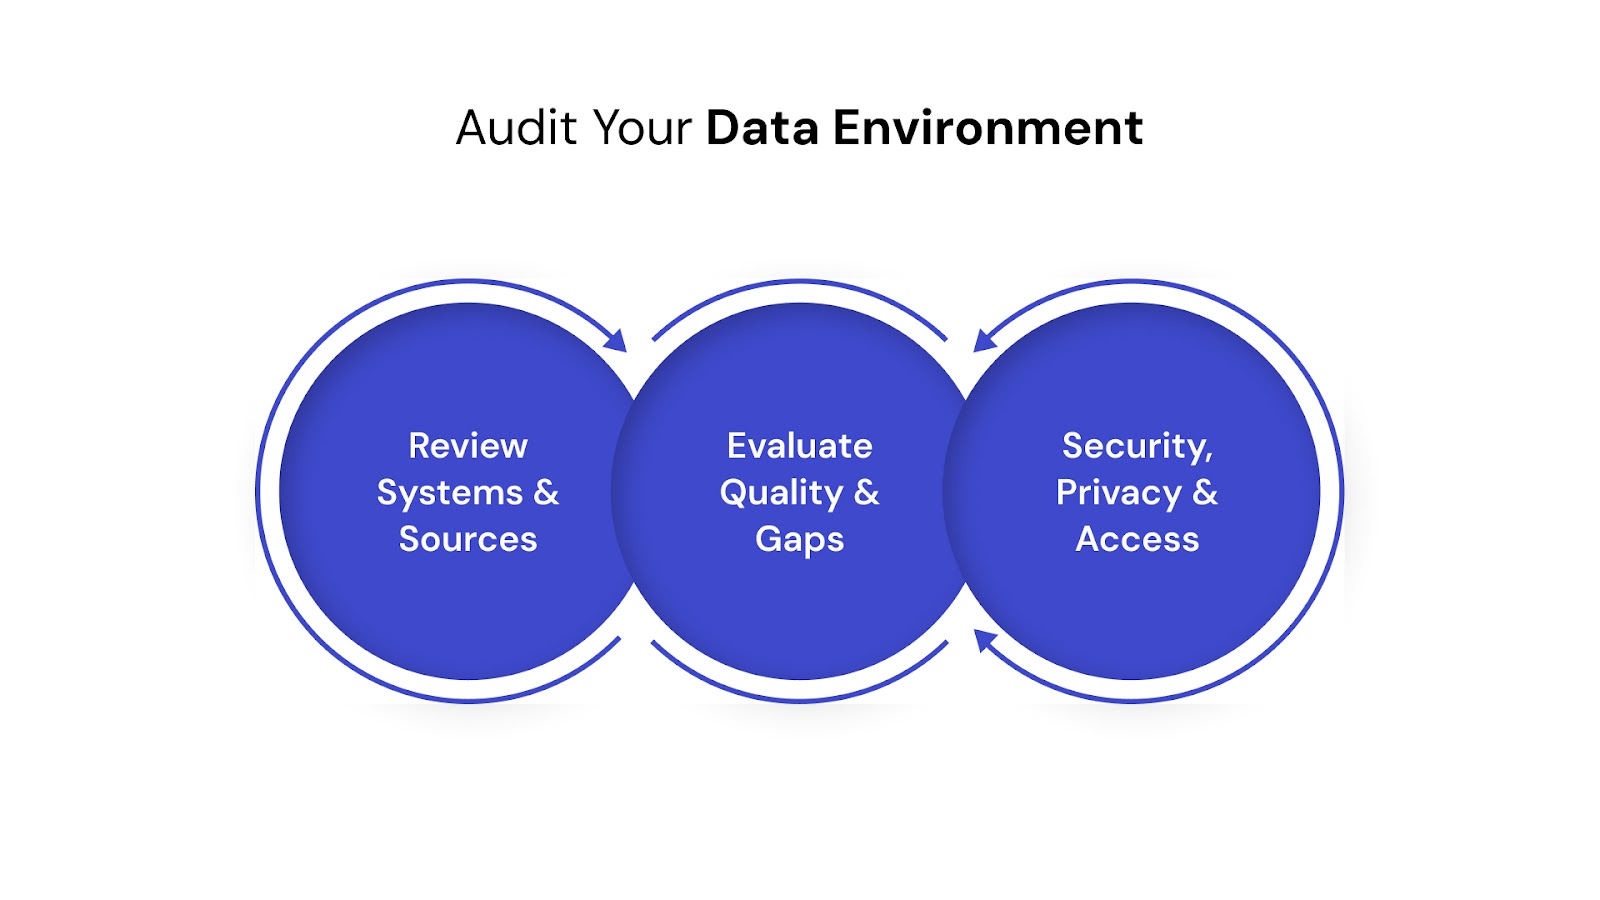
List all tools and platforms collecting data, from CRMs to cloud storage. Highlight what's in use, what’s redundant, and what needs integration.
Example: A retailer finds Salesforce, Shopify, and Zendesk disconnected and underused.
Action Step: Conduct a full inventory and label each source as "active," "unused," or "needs integration."
Check datasets for errors, duplication, or outdated entries. Clean and standardized data increases accuracy.
Example: Poorly formatted addresses lead to faulty delivery tracking.
Action Step: Use tools like Talend or Great Expectations to profile and validate data.
Review access controls and ensure compliance with data protection laws. Confirm data is encrypted, access is logged, and retention rules are followed.
Example: A sales team exporting customer data without logs puts the company at risk.
Action Step: Update access permissions and audit logging practices.
With a clear view of your data landscape, it’s time to select the tools to support your strategy.
Choose tools based on integration capabilities and team skill levels. Platforms like Power BI, Tableau, or Looker work well for reporting and visualization.
Example: A fintech company picks Power BI for seamless integration with its Microsoft stack.
Action Step: Test 2–3 tools using real dashboards built from internal datasets.
Centralize data using ETL tools like Fivetran or Airbyte and storage platforms such as Snowflake, BigQuery, or Redshift. For real-time needs, consider Kafka.
Example: An e-commerce business integrates Shopify and Facebook Ads into Snowflake via Fivetran.
Action Step: Pilot an ETL pipeline using two high-priority data sources.
Choose platforms that can grow with your data and team. Prioritize tools that connect easily to your current stack.
Example: A startup moves from spreadsheets to Redshift to prepare for user growth.
Action Step: Sketch a scalable architecture plan with 12–18 month projections.
Even the best tools won't work without the right people using them.
Also read: Data Ingestion Framework: Key Components and Process Flows
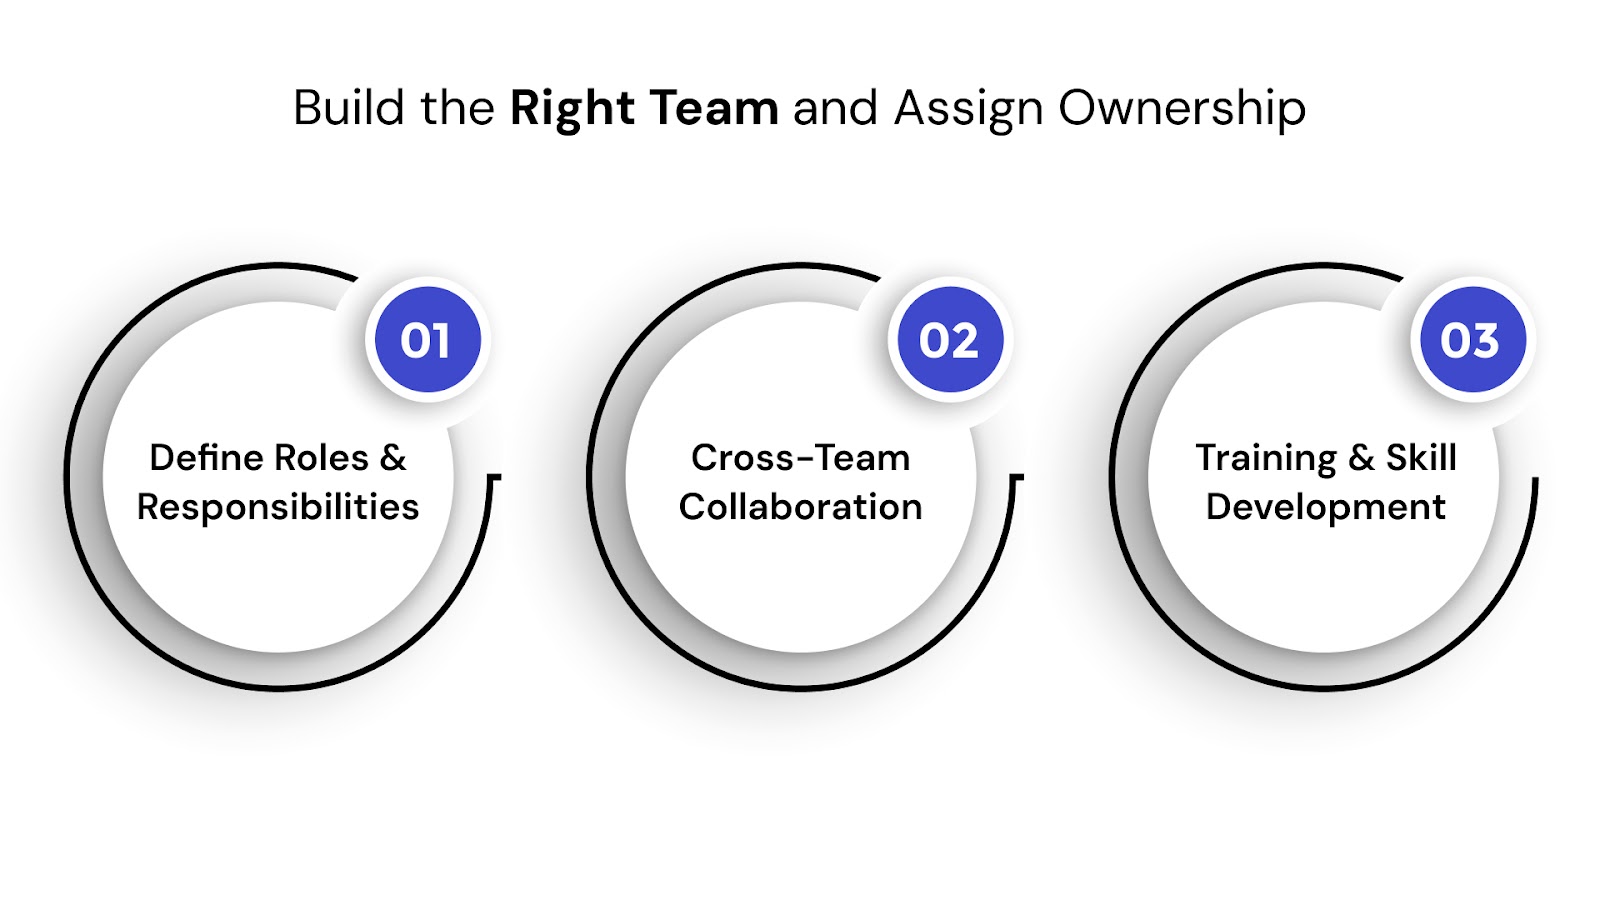
Create a cross-functional team with clear accountability. Analysts build reports, engineers manage pipelines, and business leads act on insights.
Example: The marketing lead and analyst collaborate to fine-tune campaign metrics.
Action Step: Use a RACI matrix to clarify each role.
Create recurring forums where technical and business teams discuss analytics insights and needs.
Example: A company hosts a monthly "Data Day" where teams share findings and blockers.
Action Step: Schedule monthly syncs between analytics and business units.
Offer workshops, mentorships, or online courses to upskill team members on tools and interpretation.
Example: Plant managers in a factory are trained to read downtime dashboards.
Action Step: Launch a quarterly training plan aligned with tool adoption.
Need help shaping your data analytics strategy? QuartileX builds custom ingestion pipelines focused on resilience, scalability, and accuracy. Explore our data engineering capabilities here.
Even with tools and talent in place, adoption won’t happen automatically. To see results, every team must feel ownership over data and understand how it helps them perform better.
Design dashboards that reflect each team's KPIs. Avoid adding unrelated data that causes confusion.
Example: A sales dashboard includes win rate and deal size, not support ticket volume.
Action Step: Interview each team to identify their top three recurring data questions.
Create habits that encourage sharing findings. Slack threads, weekly recaps, or internal newsletters work well.
Example: Finance shares how forecast accuracy improved with new dashboard inputs.
Action Step: Start a company-wide "Data Wins of the Week" update.
Build templates and easy-to-use tools for non-technical users. Make dashboards accessible and intuitive.
Example: HR uses a self-serve dashboard to track turnover without technical help.
Action Step: Launch a central data hub with guides and dashboard links.
A data strategy isn’t a one-time setup. To stay effective, it needs regular check-ins, updates, and adjustments based on how your business and market conditions change.
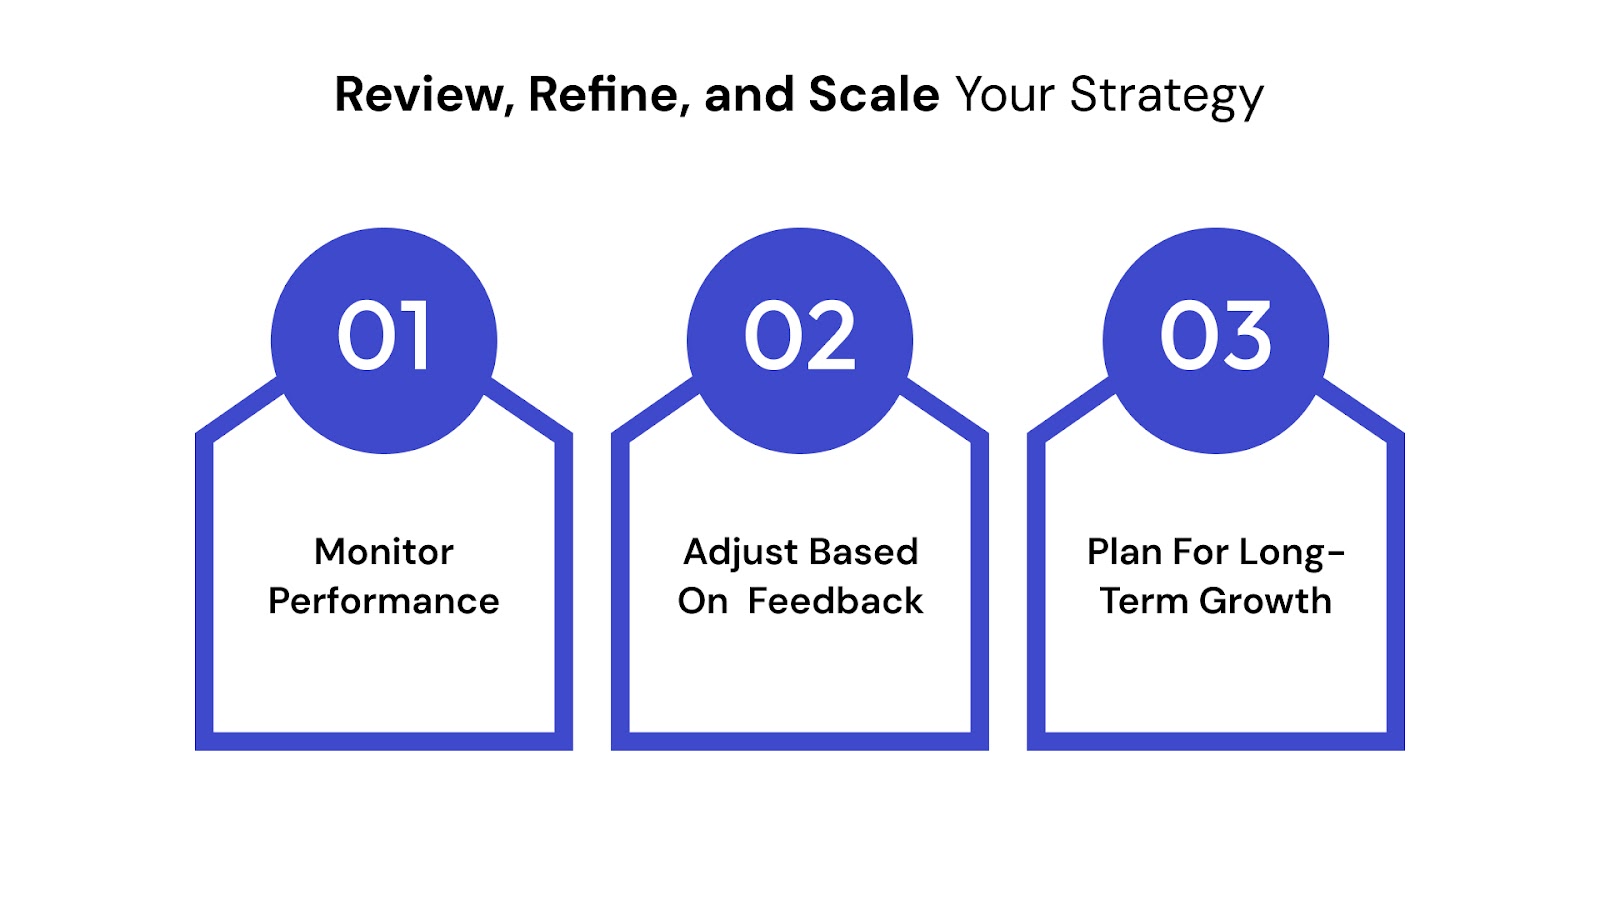
Compare performance before and after changes. Use real metrics to confirm whether your strategy is working.
Example: Updating lead scoring leads to a 22% rise in qualified leads.
Action Step: Set up monthly reviews of KPI performance and trends.
Collect user input on dashboards and reports. Improve clarity, timing, or design based on feedback.
Example: A marketing team swaps pie charts for trend lines to improve weekly campaign analysis.
Action Step: Hold quarterly usability reviews for analytics outputs.
Once foundational analytics are in place, scale with predictive modeling, automation, or external data sources.
Example: A logistics firm adds weather and traffic data for better demand forecasting.
Action Step: Define two analytics goals for the year and map required tools or skill upgrades.
Read our blog on Minimising Data Loss During Database Migration
Once your strategy is in place, the next challenge is making it work across daily operations and decision-making. That’s where execution matters most.
Creating a strategy is just the start. The real impact comes when teams apply it to real scenarios. For example, a sales team might use lead scoring data to prioritise outreach, while a product team tracks feature usage to decide what to improve next.
To make your strategy work:
When analytics becomes part of routine decisions, not just quarterly reports, your strategy starts to create real business value.
We don’t just implement technology — we solve real-world problems with intelligent, secure, and scalable solutions.
Let’s Talk Strategy →
A clear data analytics strategy helps businesses move from guesswork to informed decision-making. Whether you're building a new setup or refining an existing one, aligning goals, tools, and teams is essential for getting measurable value from your data.
This guide outlined a six-step approach to help you build a focused and scalable strategy. From defining KPIs to encouraging team adoption, each stage brings you closer to better insights and smarter business outcomes.
Data Analytics Strategy with QuartileX
At QuartileX, we help you turn strategy into action. Whether you're just starting out or improving your current analytics stack, our team offers expert support across every phase of the journey.
Here's how we contribute value:
We believe in practical solutions tailored to your business needs. From one-time consultations to full-scale implementation, we help you build analytics systems that grow with your business.
Ready to move from data collection to data confidence? Connect with a QuartileX expert today.
Yes. Even small businesses can gain value by aligning analytics with specific business priorities. A structured approach helps avoid wasted effort and leads to better decisions from day one.
Not necessarily. You can start with part-time analysts or external consultants. As your data needs grow, you can scale your team or bring in specialists in engineering, analytics, or governance.
Low dashboard usage, inconsistent KPIs, siloed data, or decisions made without data input are common signals. If insights aren’t influencing real business actions, it’s time to reassess your approach.
A quarterly review is ideal. This helps you adjust based on business performance, new data availability, or team feedback without overhauling the system too frequently.
It depends on your scale. Early-stage businesses can start with simple tools like Google Sheets or Data Studio. As complexity grows, tools like Power BI or Looker become more useful for scalability and collaboration.
Yes. Third-party data such as market trends, weather, or traffic can add context and improve forecasting accuracy. It’s especially useful in sectors like logistics, retail, and finance.
From cloud to AI — we’ll help build the right roadmap.
Kickstart your journey with intelligent data, AI-driven strategies!